The graph below, originating from the Variety article titled, “After L.A. Fires, Bringing Production Back Has Become More Urgent Than Ever” is an example of quantitative research used to support the writer’s reporting about the state of film and television production after the California wildfires.
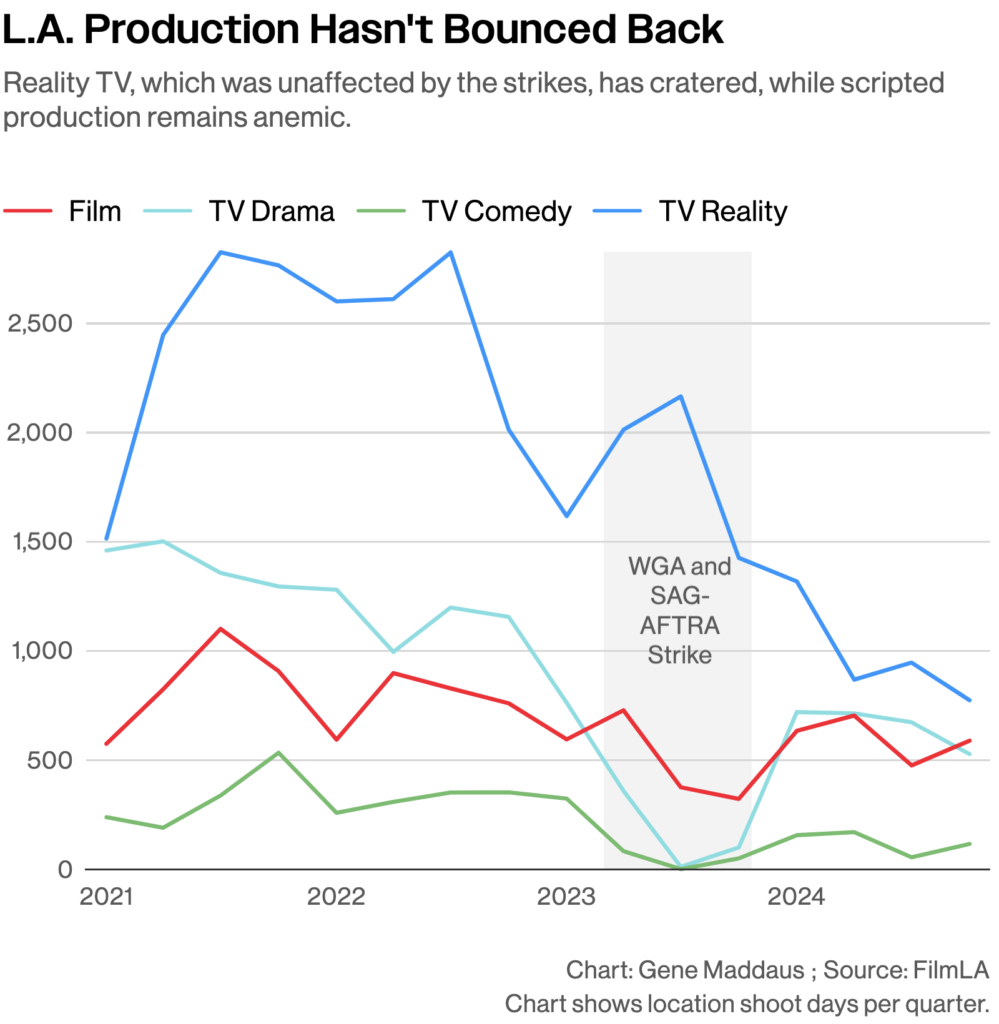
This graph is an example of quantitative research because it utilizes empirical data to quantify the amount of production by tracking the number of shooting days per quarter. While the graph quantifies the fluctuating amount of production from 2021 to 2024, the article’s authors utilize this quantitative research to support their reporting on the state of film and television production in Los Angeles after the California wildfires. For this article, quantitative research effectively supports the authors’ reporting about production in California in addition to interviews with industry insiders.
Personally, I am the type of film student who enjoys reading trade magazines like Variety and The Hollywood Reporter because I am able to learn about multiple current issues that the industry navigates in a more accessible form versus reading academic literature. Furthermore, I enjoy reading film industry trade magazines because I learn more about currently circulating movies and television shows, often directly from filmmakers and industry insiders.

This entry is licensed under a Creative Commons Attribution-NonCommercial-ShareAlike 4.0 International license.